


Finance, Media, Hamilton Resident.
Back in the dim, dark days of 2003,Hamilton City Council’s debt sat at $100m. It rose slowly for a few years then started increasing more rapidly to reach almost $200m in 2008, broached $300m in 2011 and reached $383m in 2014.
People were incredibly concerned at this “enormous” level of debt. Council acted and produced a Long Term Plan (LTP) that showed almost no increase in debt levels over the next 8 years.

Brilliant! This was fantastic news for residents and ratepayers – it showed them that the council had listened and had a genuine desire for fiscal prudence.
For sure.
Uh-huh.
The next year, council did projections out to 2025. Although here was a slight increase in debt to almost $500m by then, it seems minimal and thoroughly responsible.

More great news – or was it?
Roll on to 2025 and what was the actual end result? Was it $500m like the graph above shows? Was our debt at the end of the 2025 financial year (and it’s not finished yet) a mere $500m?
I’ll get to that in a moment.
In the 2018 LTP, council produced this graph of net debt.

Rather than a reasonably stable looking graph, the period from 2019 to 2023 showed a rapid increase in debt to nearly $800m. This is a fairly long way north of $500m. But, not to worry, the subsequent 5 years show debt will plateau – again – and not exceed $800m. At least through to 2028.
Not so fast!
Along comes 2021’s LTP and it seems to have encountered a spanner in the forecasting works.

This graph shows that net debt was forecast to grow to nearly $1 BILLION dollars in 2024, crossing the $1bn threshold in 2025. But it would plateau (of course) for the next few years with only a small increase to $1.16bn in 2031.
OK. A bit of a spike – a mere increase of $200m on the forecast – but at least the growth in debt would slow down. Except…
What’s this? 2025 net debt is projected at$1.25bn?!?
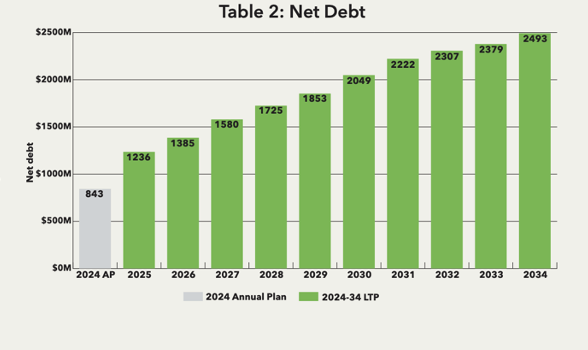
And the projected debt figure for 2031 – according to the 2024 LTP – is now $2.22 billion?!? With it increasing to $2.5bn in 2034?
Wow! Now that’s a lot of money. A LOT! But, putting that to one side for a moment (as if you really can), what is going on here? Has there been insufficient investment in legacy infrastructure projects and we are playing catch-up? Or is council now frivolously spending money like there’s no tomorrow with little-to-nothing to show for it – empty cycle lanes, speed humps and empty buses aside?
Well, that’s actually not really the point of this piece – as alarming as these debt figures are.
The point is the accuracy of council’s LTP forecasting of debt.
Not a single ONE of these projections has been remotely achieved. The pie-in-the-sky plateauing figures are the stuff of fairy dust and unicorn excrement. We can accept that to a degree, but what is more alarming is that the latest projections have ditched that plateau fantasy and gone for what appears a more realistic view.
But is it though? Given council’s track record over the last 10-plus years of utterly ridiculous forecasting, why would the 2024 LTP projection be any different? If they run true to form and this doubling of debt to $2.5bn in 2034 gets blown out of the water by reality, we are in for stratospheric and catastrophic debt levels. Every past projection has demonstrated this.
Every single one.
And that’s before we even get to the CCO for waters. A CCO that will be allowed to borrow 500% of its income compared to council’s threshold of 285%. And who will be footing the bill?
The residents and ratepayers.
Every single one of us.
*All graphs are from Hamilton City Council Annual Report Summaries and Long Term Plans from 2018-2024
Other posts


Join Us in Making Change
Support our mission to hold the council accountable and stay updated with our newsletter.
